Screens
Reports
The report builder: recorded hours or expense claims, filtered, grouped and counted in hours or money, with the controls to save, download and print what is on screen. How to use it from start to finish is in Build and save reports.
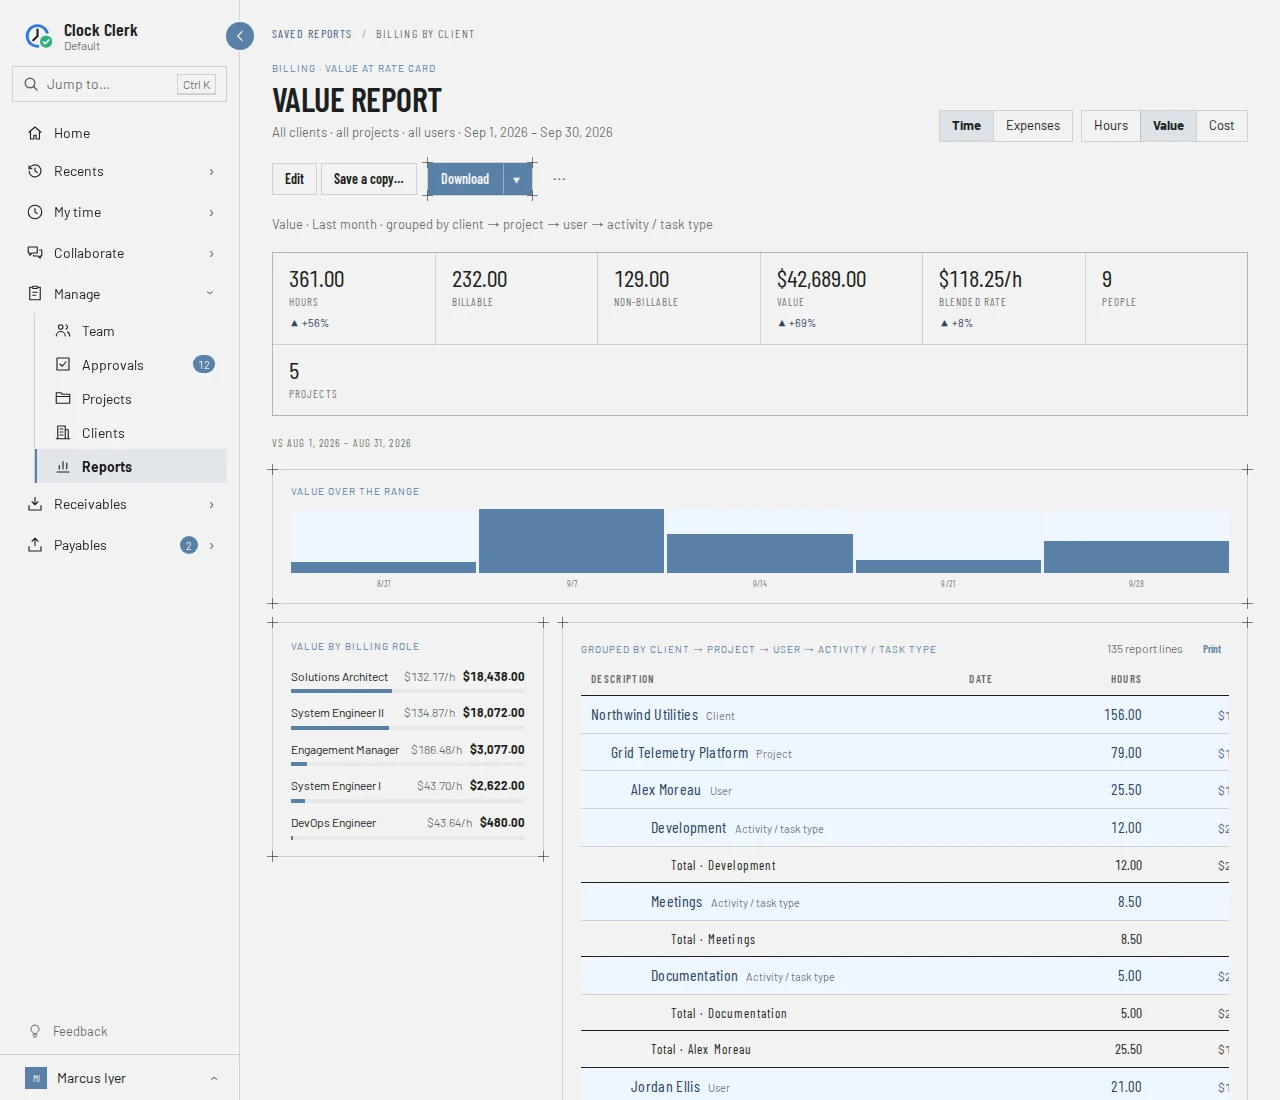
Who sees it
Managers, Finance users and administrators, at /reports/view for a saved or standard report and /reports/new for a new one. It opens from a report's name or New report on Saved reports, which is what Reports in the menu and /reports open, or from Jump to. Opened without a report named, it shows a blank one: it never reopens your default report or the last one you had open. A link or bookmark to a report from before Saved reports came first still opens that report here. Users and guests are told You don't have access to this area.
A manager's screen covers the projects they manage, and the clients, people and rates on them. Finance and administrators see the whole organization. Who sees what sets the two side by side.
The heading
- The breadcrumb: Saved reports, then the open report's name, or Unsaved report.
- The kicker and title say what is counted: Utilization · hours over an Hours report, Billing · value at rate card over a Value report, Delivery · what the time cost over a Cost report, or Expenses · what was claimed over an Expense report.
- The line under it repeats the filters and the dates. Notes under that say when part of a shared report is outside what you can see, when a cost report is shown at its value, and who has no team cost recorded.
- Time and Expenses choose what the report is a list of. For time, Hours, Value and Cost choose what it counts. Cost is there for Finance and administrators on a plan with team costs, and for nobody else.
Edit and Done
A saved or standard report opens on its results: the tiles, the chart and the table. In place of the filters, one line says what it counts, which dates and how it is grouped, such as Value · Last month · grouped by client → project → user → activity / task type, in the same words as its row on Saved reports. The line under the title still names the filters.
- Edit, beside the save button, shows the filters and Fields & summaries. It then reads Done, which hides them again.
- While you have changes the report does not keep yet, Done is not offered: save them first, or leave the report and choose Discard changes. Saving leaves the panels open.
- Time and Expenses, and Hours, Value and Cost, stay at the top right either way, and change the report without opening the panels.
- A new report, from New report or ⋯ → Reset to a blank report, has nothing to show until it is built, so it opens with the panels showing and has no Edit.
- Opening another report, from Jump to or Recents, opens it on its results too. Whether the panels are showing is not part of the report: it is not saved, and a link to the report does not carry it.
The filters
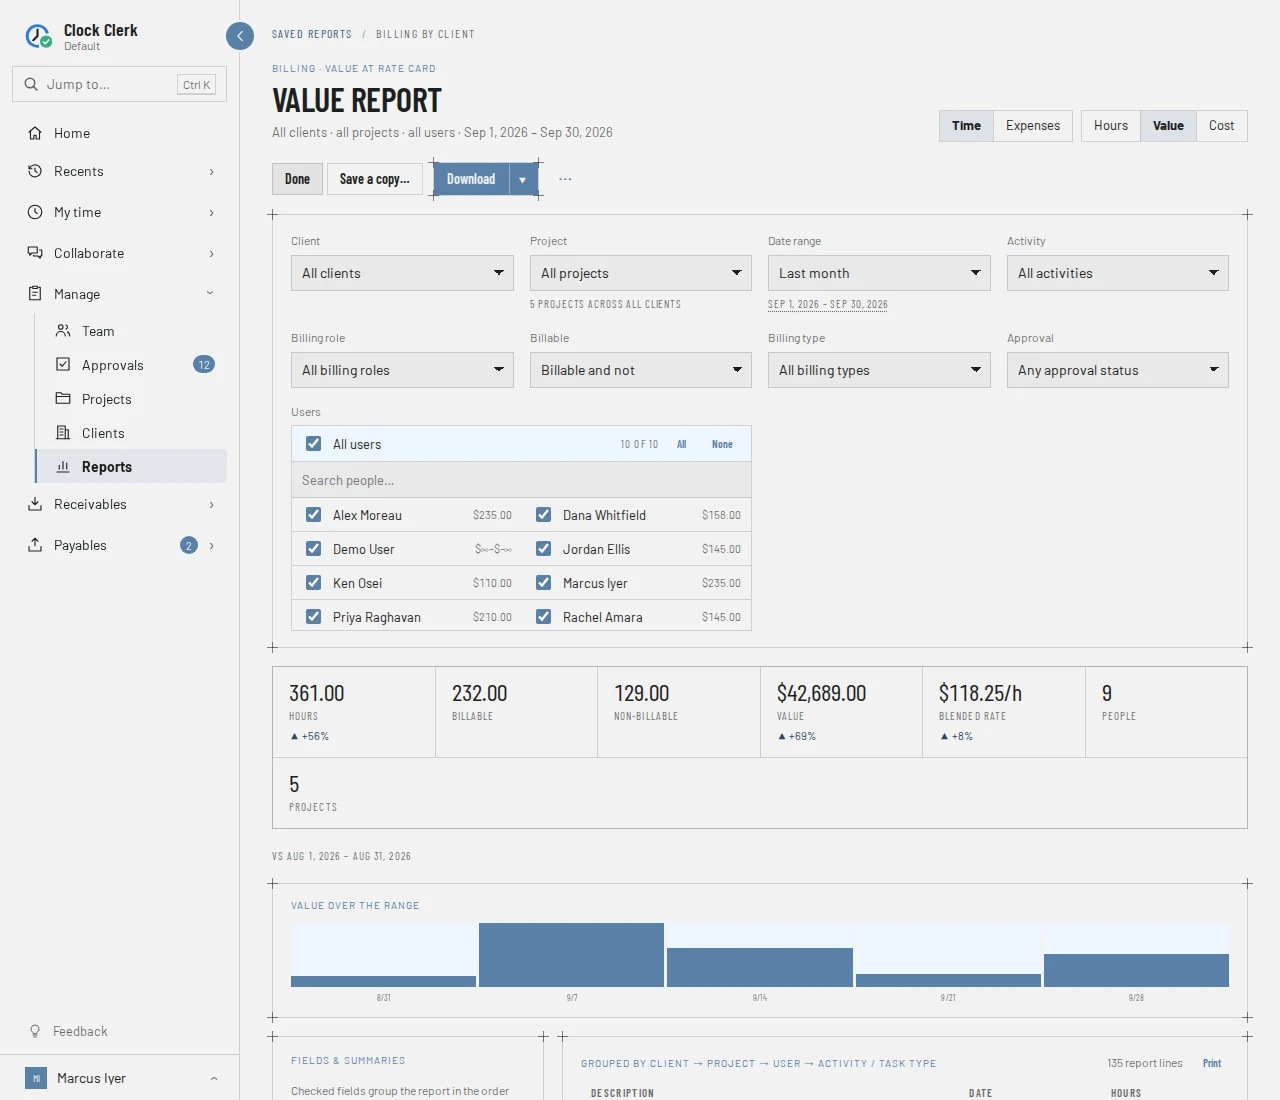
Shown under Edit on a saved or standard report, and always on a new one.
| Filter | Choices |
|---|---|
| Client, Project | All clients or one; All projects or one, of the chosen client where there is one. The count under Project says how many there are. |
| Date range | This week, Last week, This month (the starting point), Last month, This year, Last year, or Custom with From and To. The dates under a choice are a button that switches to a custom range on those dates. |
| Activity, Billing role | All, or one. Time only: a claim has neither. Activity is left out where nothing in your organization asks for one (see When activities are off). |
| Billable | Billable and not, Billable time only, Non-billable time only. On expenses: Billed to clients only, Not billed only. |
| Billing type | All billing types, Time and materials, Fixed, Non-billable: how each project is sold. |
| Approval | Any approval status, Awaiting approval, Approved, Returned, Not submitted: where the week each hour or claim falls in stands. |
| Users | All users, with how many are ticked, All, None, Search people…, and a tick for each person, with the rates their billing roles carry on a Value report. |
The tiles and the chart
For time: Hours, Billable and Non-billable; on a money report Value or Cost and the Blended rate; then People and Projects. For expenses: Claimed, Billable to clients, Reimbursable and Claims, with how many were declined. Hours, money and the rate carry their change, ▲ or ▼, against the same stretch of the period before, which is named under the tiles. Below them, a chart of the hours or money over the range, for time.
Money is shown to the cent everywhere on the screen, in the tiles, the chart, the table and the rates beside each person, as it is in the downloads, so the figures on the screen and in the file you download agree.
Show summary tiles and chart, under Fields & summaries, takes them away.
Fields & summaries
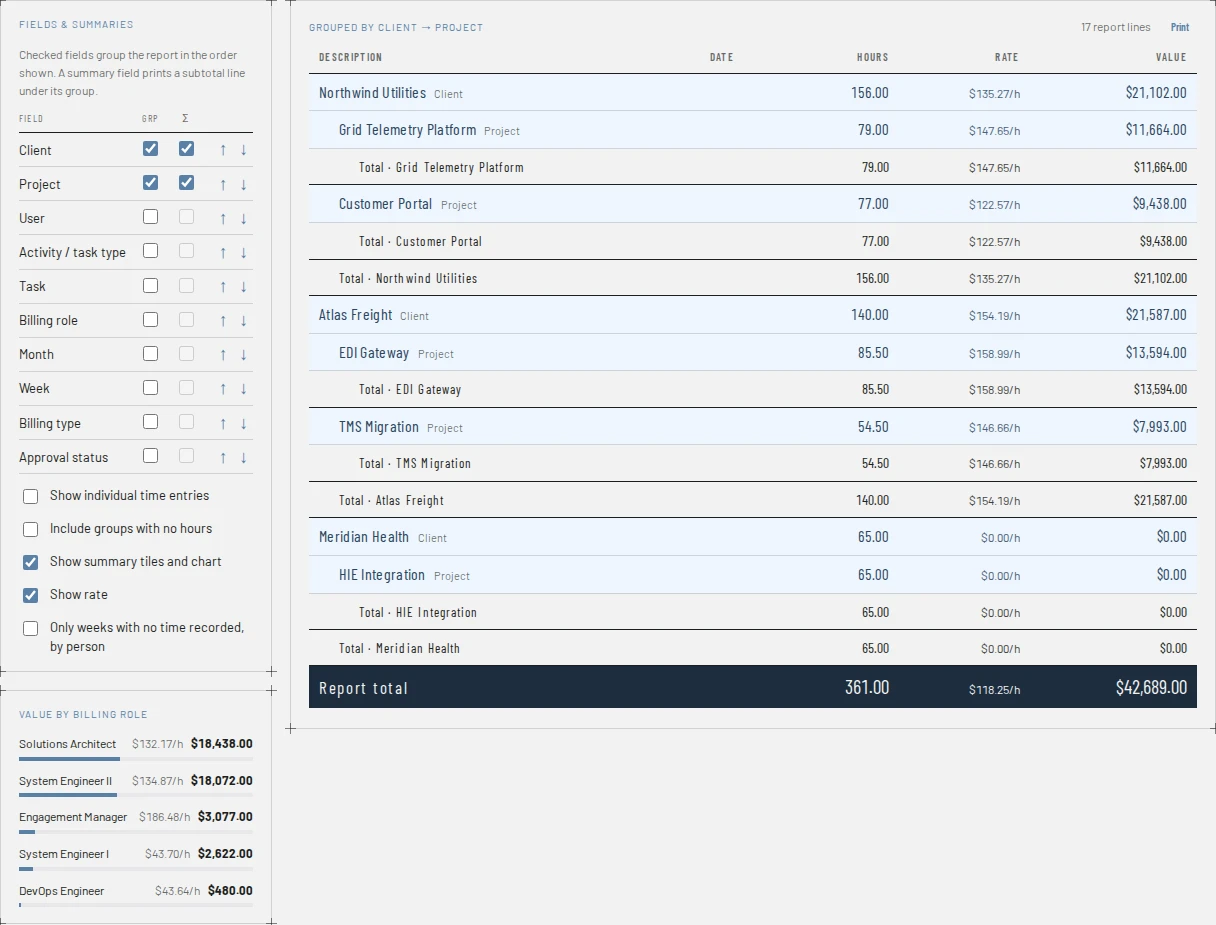
Beside the table, under Edit on a saved or standard report. One row per field: tick Grp to group by it, Σ to print a subtotal under each of its groups (only on a grouped field), and ↑ or ↓ to move it, since groups nest in the order shown. A time report offers Client, Project, User, Activity / task type, Task, Billing role, Month, Week, Billing type and Approval status. An expense report drops task, billing role and activity and adds Expense category. Where nothing in your organization asks for an activity, Activity / task type is not offered either (see When activities are off).
Under the fields:
- Show individual time entries, or Show individual claims: every entry under its group, its comment first. The screen lists the first 1,000 and says so; the download has the rest.
- Include groups with no hours, or Include groups with no claims.
- Show summary tiles and chart.
- Show rate, on a money report: the Blended rate tile and the Rate column.
- Only weeks with no time recorded, by person: a list of each person's empty weeks and where their filing stands, in place of the grouping.
Below it, for time, Hours by billing role, Value by billing role or Cost by billing role: a bar for each role, with its rate on a money report.
The table
Headed by the grouping, such as Grouped by client → project, and how many lines or entries it holds. The columns are Description, Date, Hours (or Claims), then on a money report Rate and Value or Cost, and on an expense report Amount. Group rows are shaded and indented under each other, each with what kind of group it is; a week or month row under a person also says where that filing stands, such as Approved or Awaiting approval. Subtotals start with Total ·, and Report total ends the table.
On a narrow screen the table folds into a stack of labeled figures per row. It is laid out for a wide window: at about 1,280 pixels or less, the money columns may need scrolling sideways.
When activities are off
Where your organization doesn't ask for an activity and no project is set to ask for one (see Activities), every hour is booked on the default activity, so grouping or filtering by activity would show one group. The report then leaves activity out: a blank report is grouped by client and user only, the Activity filter and the Activity / task type field are hidden, and Billing by client groups by client, project and person. A saved report or a link that already groups or filters by activity keeps it, and keeps the controls to undo it. Its hours appear under the default activity's name. Once any project asks for an activity, everything is offered again.
Buttons and when they appear
| Button | What it does | When you have it |
|---|---|---|
| Edit, Done | Shows the filters and Fields & summaries, or hides them again (see Edit and Done). | On a saved or standard report. Done is not offered while there are unsaved changes. |
| Save | Keeps your changes in the open report. | On a report you can change: your own, or as an administrator any you can open. Disabled until something has changed. |
| Save as… | Opens Save report to keep this as a new report of yours. | On an unsaved report or one somebody else owns. |
| Save a copy… | The same, starting from the report's name with — copy. | On a standard report. |
| Download, ▾ | Download saves this report as Excel. The ▾ offers This report as Excel (.xlsx), CSV (.csv) or PDF…, and All entries (or All claims) as Excel or CSV. PDF… opens the same print dialog as Print. | Always, including when the organization is read-only. |
| ⋯ → Saved reports | Goes to Saved reports. | Always. |
| ⋯ → Save as a copy… | Keeps this report under a new name, leaving the open one as it was saved. | On a report you can change. |
| ⋯ → Rename…, Delete report… | Renames the report, or deletes it after Delete “…”?. | On a report you can change. |
| ⋯ → Make default report, Clear default report | Lists this report first among your saved reports, under Pinned, for you, or puts it back in its place. | On any saved report you can open. |
| ⋯ → Save a copy as my default… | Saves a copy of a standard report and makes the copy your default. | On a standard report. |
| ⋯ → Reset to a blank report | Hours for this month, grouped by client, user and activity, or by client and user where activities are off. | Always. |
| Opens the browser's print dialog for the report alone. Leave Margins on Default under More settings in the print dialog, so the printout keeps its own margins. | Above the table, always. | |
| Try again | Loads the report again. | When it could not be loaded. |
Saving, renaming, deleting and choosing a default are checked again when you press them, and refused while the organization is read-only (see Roles). What you see in a report is always cut to your own reach, however it reached you.