Workflows
Build and save reports
Managers, Finance and administrators report on the organization's time under Reports: recorded hours or expense claims, cut by client, project, person, dates and approval, grouped and subtotaled the way you choose, and counted in hours or money. A report you will want again is saved, shared with the other managers or pinned to the top of your list, and any report can be downloaded or printed.
Who sees what
| What | Manager | Finance and administrators |
|---|---|---|
| Whose time and claims | Everyone's, on the projects they manage: where their grant on the project comes out as Manager. Nothing booked to any other project. | The whole organization, with no grants needed. |
| Hours, and Value at the rate card | Yes, priced with the rates of their own projects and clients. | Yes. |
| Cost: what the time cost to deliver | No. | Yes, on a plan with team costs: Team, Enterprise and the trial. |
| The Cost of internal work standard report | Not offered. | Yes. |
| Save, share, download and print | Yes. | Yes. An administrator can also rename and delete a report another manager shared. |
Users and guests have no Reports in their menu, and opening its address tells them You don't have access to this area. Where a manager's reach comes from is explained under Grants and project teams.
1. Open a report
- Choose Reports in the menu, under Manage. It opens Saved reports: the standard reports every organization has, then the reports you and the other managers have saved.
- Choose a report's name to open it, or New report to start from a blank one: hours for this month, grouped by client, then user, then activity. Where nothing in your organization asks for an activity, activity is left out of it, and of the filters and fields below (see When activities are off).
A saved or standard report opens on its results: the tiles, the chart and the table, with a line such as Value · Last month · grouped by client → project → user → activity / task type saying what it is. Its filters and Fields & summaries are behind Edit, beside the save button; Done hides them again. A new report opens with them showing, since there is nothing to show until you build it. See Edit and Done.
Jump to (Ctrl + K) opens a report without the list: type part of its name, or New report for a blank one. Reports you opened lately are also under Recents, at the top of the menu.
Going straight to /reports opens this list. Nothing reopens on its own: your default report, if you have one (step 7), is the first row of the table of saved reports, under Pinned, below Standard reports.
2. Choose what it counts
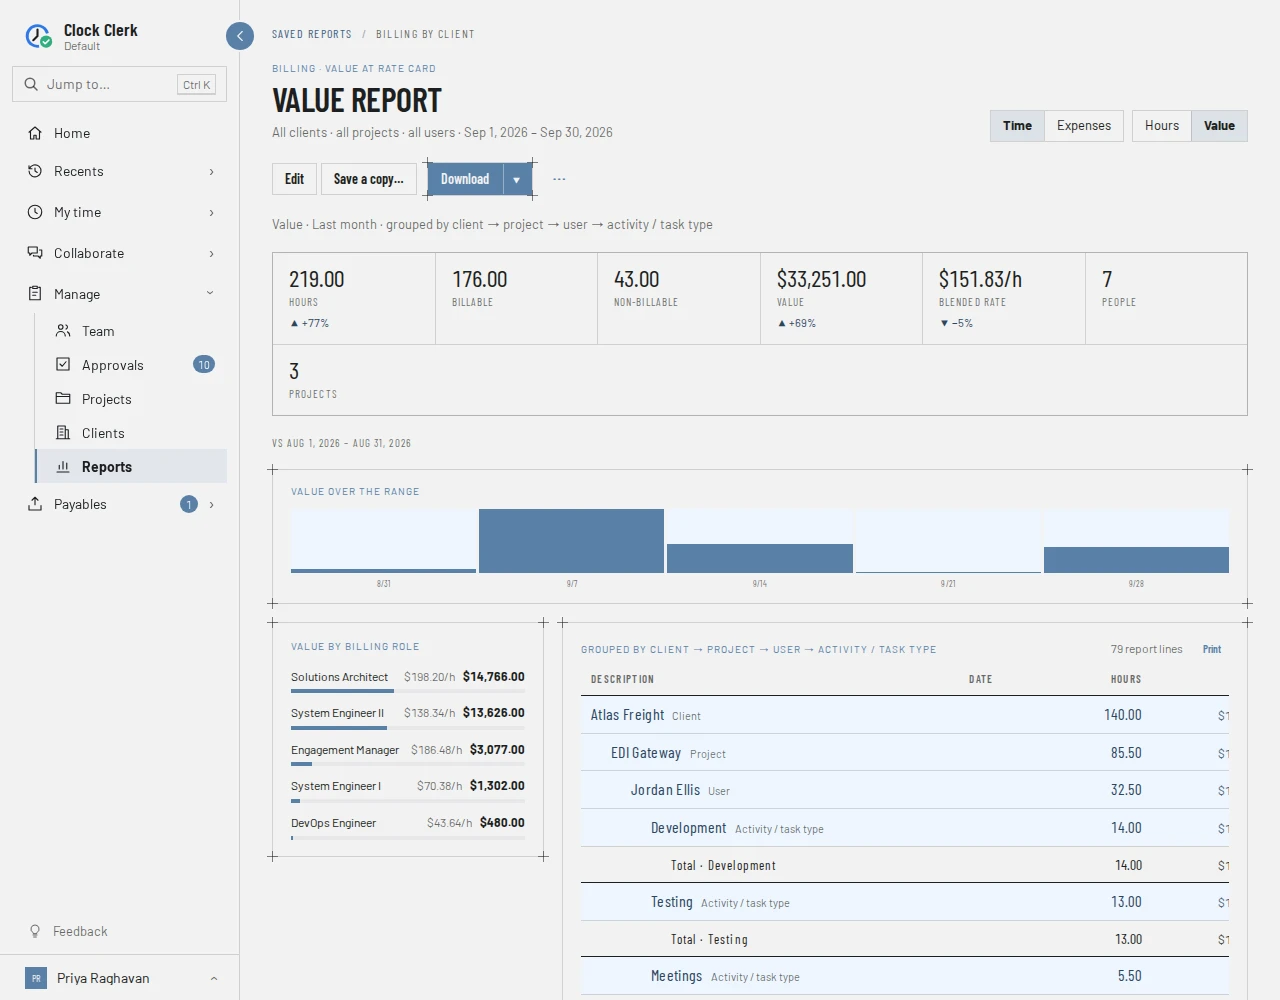
Two switches at the top right decide what the report is a list of and what it counts:
- Time or Expenses: recorded hours, or the expense claims people made.
- For time, Hours, Value or Cost. The heading follows it: Hours report, Value report, Cost report or Expense report.
Value and Cost are two different amounts of money, and a report counts one at a time:
- Value is what the time is worth to a client, at the rate card in force on each day (see Billing rates). Time that is not billed is worth nothing: hours on a Non-billable project, or under an activity that is not billable, are counted at $0.
- Cost is what the time cost you to deliver, from each person's team cost: an hourly cost as it stands, and a monthly or annual salary spread over the hours the person recorded that month. Every hour counts, billed or not, which is what makes it the measure for internal work. Only Finance and administrators are offered it, and only on a plan with team costs.
Both are shown to the cent, as they are in the downloads.
An expense report counts Claims and their Amount, also to the cent. Declined claims are listed and tagged but left out of every total.
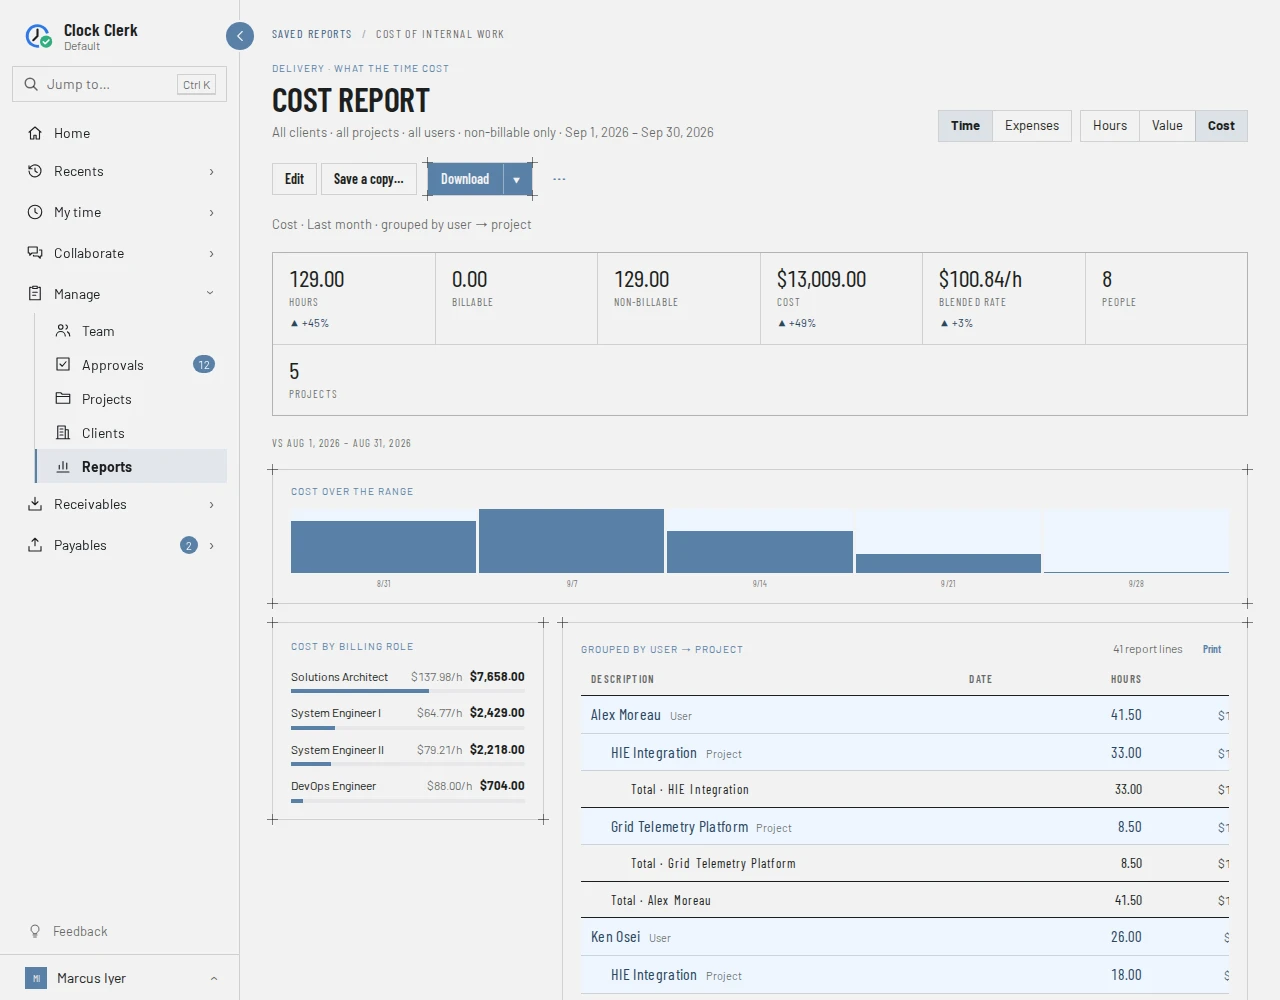
3. Narrow it down
The filters under the heading decide which time or claims are in the report. On a saved or standard report, choose Edit to see them. The line under the title repeats them, such as All clients · all projects · all users · non-billable only · Sep 1, 2026 – Sep 30, 2026.
- Client and Project. Choosing a client cuts the project list to its projects.
- Date range: This week, Last week, This month, Last month, This year, Last year or Custom, which adds From and To. The dates a choice works out to are shown beneath it; choosing them turns it into a custom range you can adjust. Weeks run Monday to Sunday, as they do on My Week.
- Activity and Billing role, for time.
- Billable: Billable and not, Billable time only or Non-billable time only. For expenses: Billed to clients only or Not billed only.
- Billing type: how the project is sold, Time and materials, Fixed or Non-billable.
- Approval: where the week each hour was filed in stands, Awaiting approval, Approved, Returned or Not submitted.
- Users: tick the people to include. All and None tick or clear everyone, and Search people… narrows the list without changing what is ticked.
4. Group and subtotal it
Fields & summaries, beside the table once Edit is chosen, decides how the rows are grouped. Tick a field under Grp to group by it, and under Σ to print a subtotal line under each of its groups. Groups nest in the order the fields are listed, and ↑ and ↓ move a field.
- The fields are Client, Project, User, Activity / task type, Task, Billing role, Month, Week, Billing type and Approval status. An expense report has Expense category instead of task, billing role and activity, which a claim does not have.
- Approval status is printed on a week or month row under a person, because that is the one row that stands for one person's filing.
- Show individual time entries (or Show individual claims) lists each entry under its group, led by the comment written on the day. The screen shows the first 1,000; a download has them all.
- Include groups with no hours lists every client, project, person and so on in the filters, even where nothing was recorded.
- Clearing Show summary tiles and chart takes the tiles and the chart off the top. On a money report, clearing Show rate takes the rate off the tiles, the table and the report's download.
- Only weeks with no time recorded, by person turns the report around: it lists each person's weeks in the range, up to today, in which they recorded nothing at all, and where each of those weeks' filings stands. Only the people and approval filters apply to it. The Weeks with no time — last month standard report is this, over last month.
5. Read it
- The tiles: Hours, Billable, Non-billable, then on a money report Value or Cost and the Blended rate, then People and Projects. Hours, money and rate show their change against the same stretch of the period before, named under the tiles, such as vs Aug 1, 2026 – Aug 31, 2026. An expense report shows Claimed, Billable to clients, Reimbursable and Claims.
- The chart: the hours or money over the range, so the total has a shape.
- By billing role, beside the table: the hours or money split by billing role, with each role's rate on a money report.
- The table: Description, Date, Hours, and on a money report Rate and Value or Cost. Group rows are shaded, subtotals follow their groups, and Report total closes it. Above it, the grouping is spelled out, such as Grouped by client → project.
What a report shows is what was recorded, as it is now: an hour changed after a report was downloaded is changed in the next one. The screen reference, Reports, goes through each part.
6. Save it
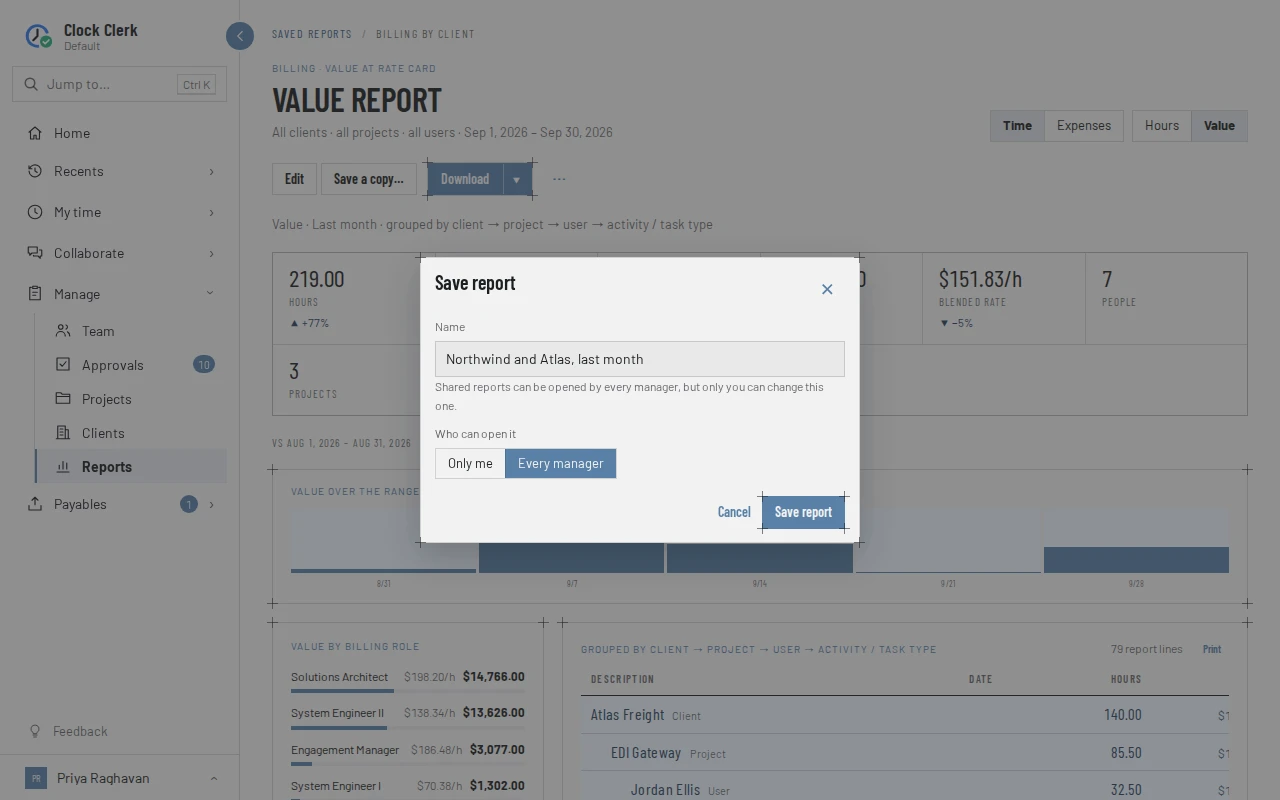
- Build the report. Once it differs from the report you opened, Unsaved changes shows beside the buttons.
- Choose the save button. It says Save as… on a new report or on somebody else's (an administrator gets Save on those), Save a copy… on a standard report, and Save on one of your own, which keeps your changes in it straight away and says Saved.
- In Save report, give it a Name of up to 120 characters. Under Who can open it, choose Only me, or Every manager to share it.
- Choose Save report. The report is now yours: it is listed under My reports on Saved reports.
A saved report keeps the report's settings, not its figures: the filters, the grouping and a range such as Last month. Opened next month, it shows the new last month. The address in your browser carries the same settings, so it can be bookmarked or sent to a colleague, who sees it cut to their own projects.
The ⋯ menu beside Download holds the rest:
- Saved reports goes to the list.
- Save as a copy… keeps your report under a new name and leaves the original as it was.
- Rename… and Delete report…, on your own reports. Deleting asks first, saying Anyone who opens this report from their own screen — or has made it their default — will lose it., and leaves the report on screen as an unsaved one.
- Make default report or Clear default report, and on a standard report Save a copy as my default… (step 7).
- Reset to a blank report.
7. Share it, or pin it
- Every manager means everyone who has Reports: managers, Finance and administrators. Each sees the report cut to what they can see, so a manager opening a report shared by Finance gets their own projects' part of it, and a cost report is shown at its value instead (see below).
- Sharing a report never hands over the right to change it. Only its owner can save over, rename or delete it, and administrators can as well. Anybody else who changes it keeps their version with Save as….
- Make default report lists a report first in the table of saved reports, below Standard reports, for you alone, under Pinned and marked Default. Clear default report puts it back in its place. A standard report cannot be a default itself, so Save a copy as my default… saves a copy of it and makes that the default.
- Leaving a saved report you changed and did not save asks Discard unsaved changes?. Discard changes leaves, and Cancel stays.
8. Download it
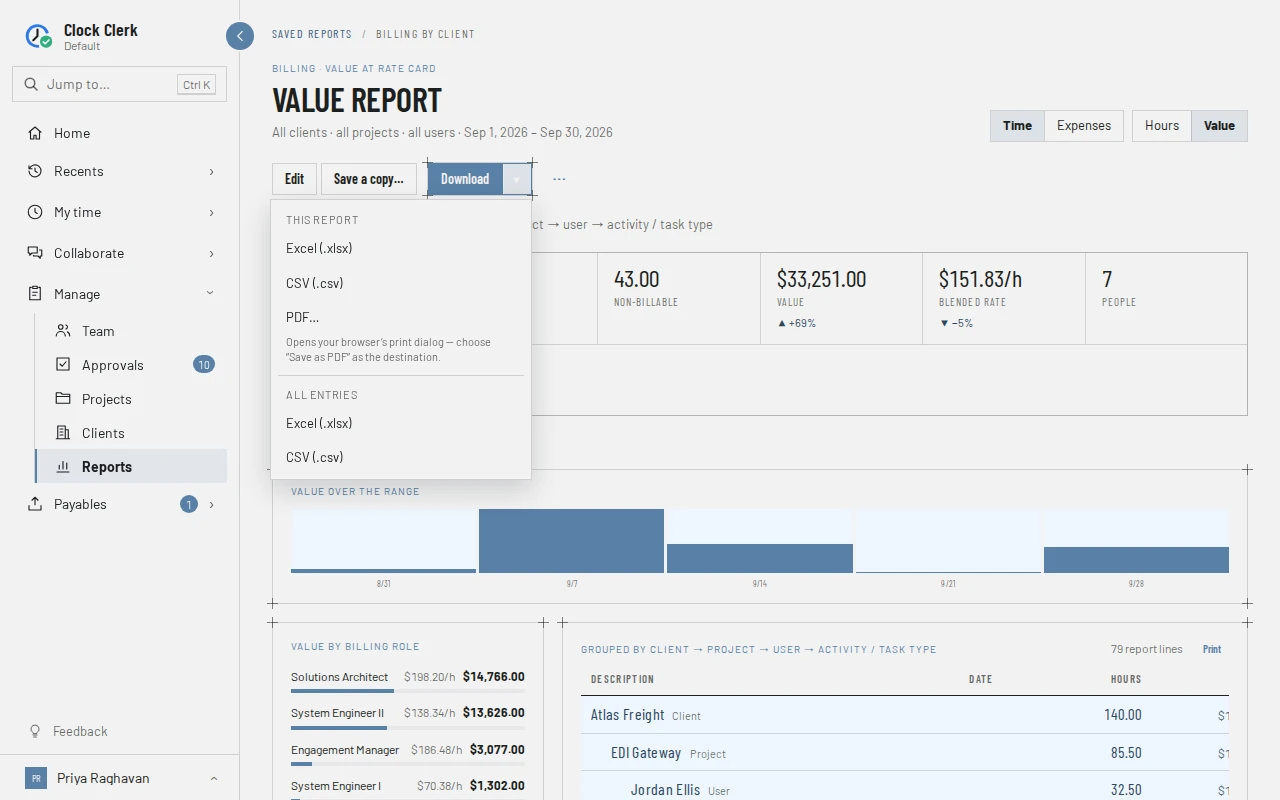
Download saves the report as an Excel workbook. The ▾ beside it offers the rest:
| Choice | What you get |
|---|---|
| This report: Excel (.xlsx) | The report as you built it, to read. Each group is named once, on its own line, with the outline buttons at the left of the sheet to fold a level away. Hours are numbers and money is currency, the header row stays in view, and an About sheet records the report's name, what it reports on, its dates, what it measures, every filter, the grouping and the day it was downloaded. |
| This report: CSV (.csv) | The same rows, to work with in a spreadsheet: one column per grouped field, with every row carrying all its group names, so it can be sorted, filtered and pivoted. |
| This report: PDF… | Your browser's print dialog, as Print below. Choose Save as PDF as the destination. |
| All entries: Excel or CSV | Every entry in the report's filters, one row each, oldest first, whatever the grouping: Date, Client, Project, Task, User, Billing role, Activity, Comment and Hours, and on a money report Rate and Value or Cost. On an expense report it is All claims. |
- In the report's files, subtotal lines are left out, because each group's figures are on its own row; the approval status gets a column of its own, and a column appears only where something fills it.
- The money column is named for what it counts, Value or Cost, so a file read a month later still says which.
- Each file is named for the report, its rows and its dates, such as billing-by-client-report-2026-09-01-to-2026-09-30.xlsx or report-entries-2026-09-01-to-2026-09-30.csv for an unsaved report's entries.
- The files are made in your browser from the report on screen, so they hold exactly what you can see.
9. Print it
Print, above the table, and PDF… both open your browser's print dialog. The page prints the report alone: its heading, the line saying what it covers and any notes under it, the tiles and the chart if they are shown, and the table, with its shading. The menu, the filters, the switches, the buttons, Fields & summaries and the billing role split are left off. Like the screen, a printout lists up to 1,000 individual entries; download the report for more. Leave Margins on Default under More settings in the print dialog, so the printout keeps its own margins.
When something goes wrong
- No Reports in the menu, or You don't have access to this area. Reports are for managers, Finance and administrators.
- A client, project or person is missing. A manager's report covers only the projects they manage. Ask an administrator for a grant (Roles).
- Parts of this report are outside what you can see — showing all clients… The report was saved by somebody who sees more than you: what you cannot see is left out, and the line says which filters were widened.
- This report is costed at what the time cost to deliver, which only an administrator or finance user can see — showing its value at the rate card instead. A cost report opened by a manager. Saved as a copy, it stays a cost report, so Finance and administrators still see its cost.
- This report is costed at what the time cost to deliver, which your organization's plan doesn't include — showing its value at the rate card instead. Cost reporting is on the Team and Enterprise plans (Plans and your trial).
- No team costs are recorded yet, so every hour here is counted at nothing. Set them under Finance → Team costs., or … has no cost recorded for part of this range, so those hours are counted at nothing. Add the missing costs on Team costs; the report is too low until then.
- A cost report opened from a link shows hours instead. Cost of internal work is only for Finance and administrators; anybody else following a link to it gets a blank report to build on.
- No time entries match these filters. Widen the date range or clear the client and user selection. Nothing recorded fits the filters.
- The To date is before the From date. or A custom range needs both a From and a To date. Fix the custom range.
- You already have a report called “…”. Names are yours alone, regardless of capitals. Choose another, or open the one you have.
- This report couldn’t be loaded. Check your connection, then try again. Choose Try again.
- Saving is refused. Your organization is read-only. Opening, downloading and printing reports still work (see Roles).